Chagsy
Australia is top of the table again. If only it were the medals table at the Olympics.
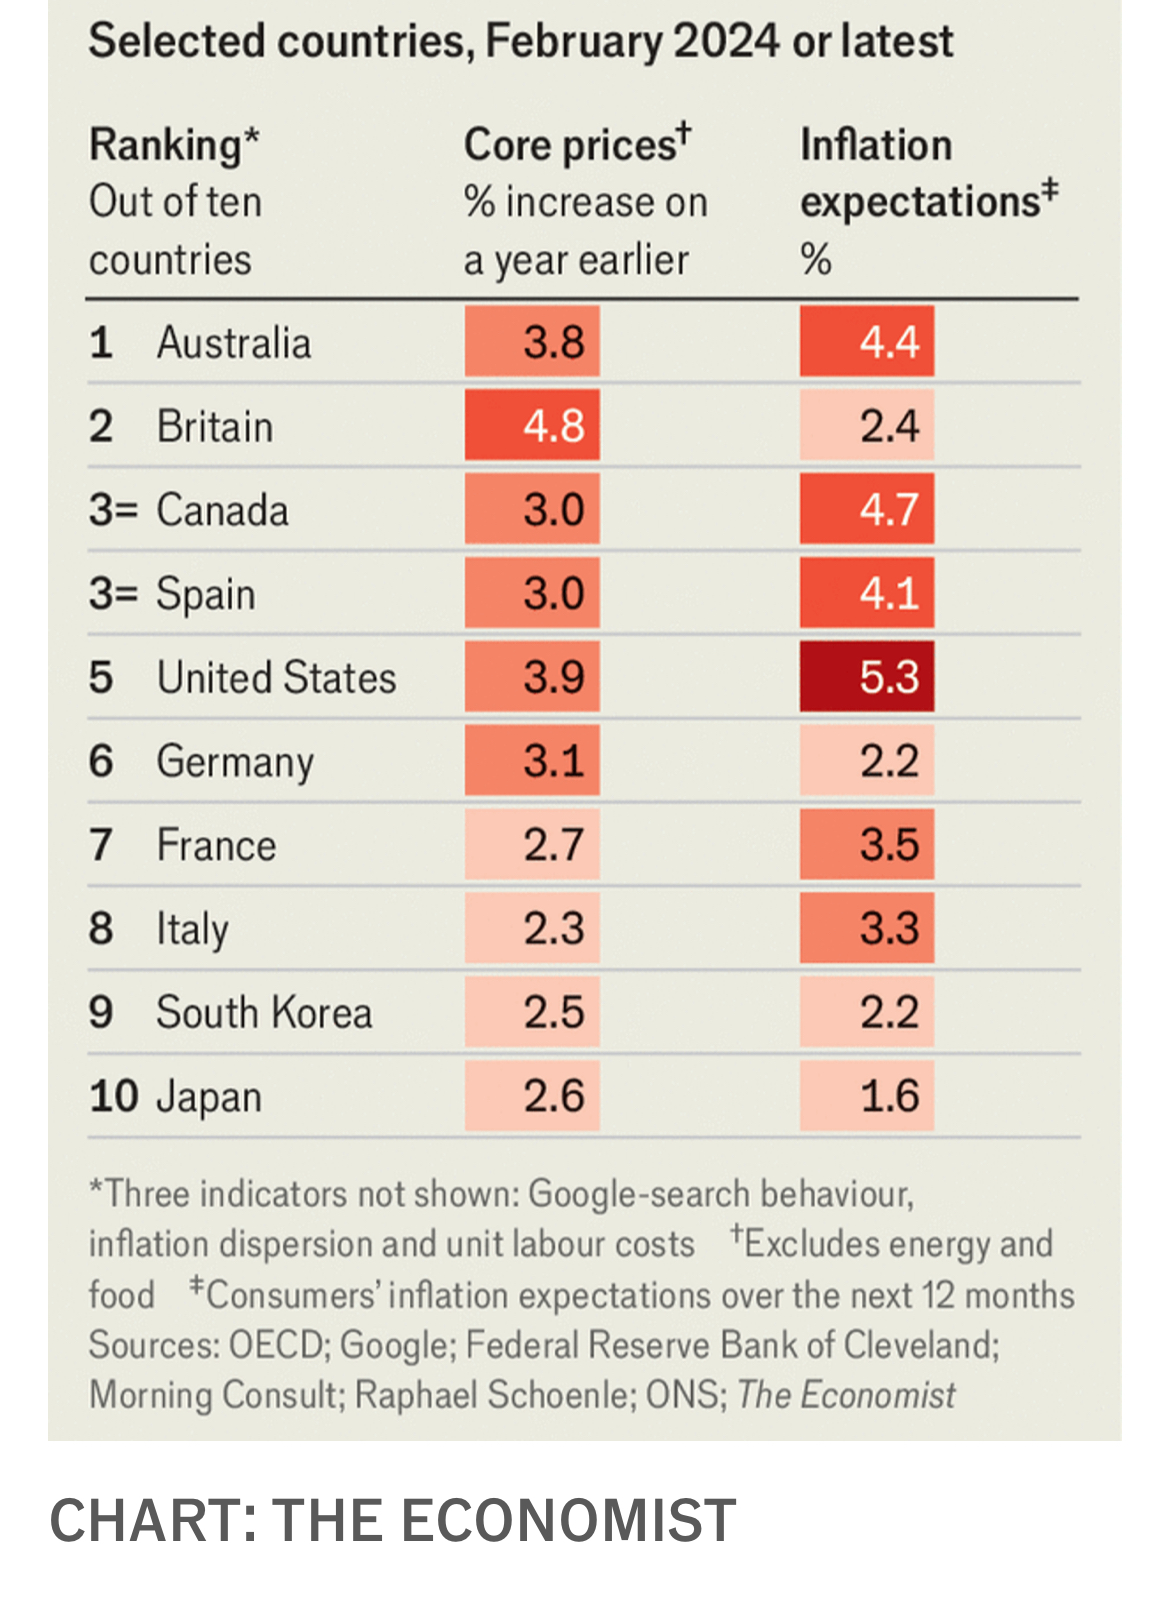
May not be a huge factor in ASX small cap investing, but all info is good info.

Chagsy
There is certainly a lot of commentary about the US market being frothy, or indeed in a bubble.
The CAPE Schiller is back up to the third highest of all time and there have been some clever analysts looking at the probability that the US market over the next 10 years will produce the same return as the last 10 years (essentially nil).
I recently discovered the following:
It is now possible for retail investors to buy into the unlisted VC space to access the likes of Open AI, SpaceX, Stripe etc.
My initial reaction is that this is another indication that we are in bubble territory. But the bubble may inflate significantly further and VC will only try to exit at the top. And a few of those companies are likely to become world beating (possibly otherworld visiting) giants of the future.
So, this is probably a live working example of @Solvetheriddle 's "what kind of investor are you?"
Mujo
MQG Developed FOMO Meter - looks like a take on the CNN one.
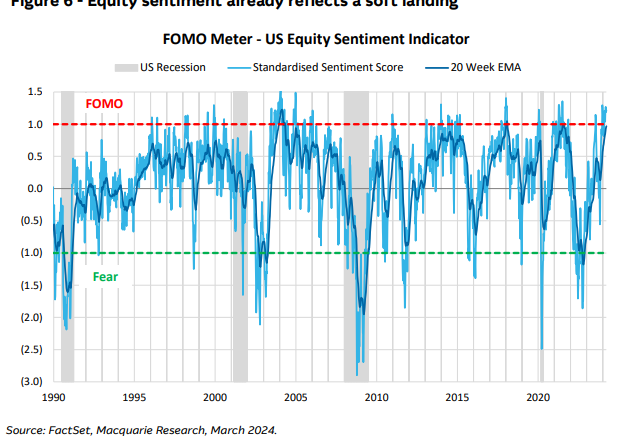
What is the FOMO Meter?
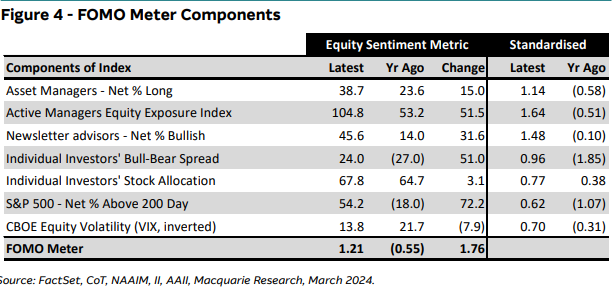
The FOMO Meter analyses equity sentiment to identify periods of excessive optimism (FOMO) or pessimism (fear of losing). The FOMO Meter has 7 components described later in the report. The latest data for each is:
1. Asset managers are 38.7% net long S&P 500 futures (+15ppt YoY);
2. Active managers have 104.8% equity exposure, nearly double a year ago;
3. Net 46.4% of newsletter advisors are bullish (+32ppt YoY);
4. Net 24% of individual investors are bullish (+51ppt YoY);
5. Individual investors' equity allocation is 67.8% (+3.1ppt YoY);
6. Net 50.2% of S&P 500 stocks are above the 200-day average; and
7. The VIX is below average at 14.3, down from 21.7 a year ago.
Unlike some other sentiment indices that are available, we focus on equity sentiment only, not sentiment in other markets (e.g. gold prices or credit spreads). We also exclude economic indicators, as we prefer to use the OECD leading indicator to track the economic cycle. Lastly, we excluded some well-known indicators (e.g. put/call ratio), as they did not seem to add value in predicting future equity returns
Chagsy
Here is a link to the 2024 forecast from FIIG.
The short version is that state and federal government spending is set to increase significantly and tax cuts are coming - so despite the economic cycle
turning towards recession there are lots of stimulatory factors.
For Bond investors they offer the following advice:
L: Lock in fixed returns. Although the big drop in rates might not come as soon as priced, the underlying story is clear. The turning point has arrived and the next large move in rates will very likely be down and will cause a sharp increase in bond prices. While we can’t be sure precisely when that movement will come, the high yields at present largely make it a moot point. The high yields mean investors are rewarded with significant interest while waiting for a move that should make them money in the medium term.
O: Obtain Real Yield. With inflation high but dropping, it might seem an unusual time to suggest buying inflation-linked bonds. However, inflation-linked bonds are still bonds – they profit from falling interest rates. They also profit from indexation if inflation proves just a touch stickier than anticipated.
C: Check your portfolio risk. While FIIG does not expect the coming slowdown to be too bad, it’s also clear that there will be an economic slowdown. To prepare for that it’s best to make sure your portfolio has as much diversity as possible. Check your bond portfolio for concentration risk or excessive exposure to sub-investment grade credits.
K: Keep your cool as the economy cools. Bonds generally perform relatively well in an economic slowdown as interest rates generally fall. By making sure that you are diversified and invested in bonds with strong links to the ongoing economy (like infrastructure or utilities) your bond portfolio should be able to negotiate the coming slowdown fairly well.